Hi, I'm Yuva Krishna Thanneru
A
Driven by a deep fascination for data analytics and a passion for machine learning.
About
I'm an Aspiring data analyst with a Master’s degree in Computer Science, adept at analyzing complex datasets and extracting actionable insights. Always strive to bring 100% to the work I do. With around 3 years of professional experience, I specialize in building robust ETL pipelines, supporting CRM systems, developing interactive dashboards, and automating workflows. My experience has honed my ability to communicate effectively with clients, ensuring clear project understanding. I thrive on tackling real-world data challenges that drive innovation across industries. Certified in Snowflake and AWS, proficient in SQL, and Python, with hands-on expertise. I continuously seek opportunities to enhance my skills and contribute to meaningful projects.
- Languages: HTML/CSS, C++, Python, Java, SQL
- Databases: MySQL, PostgreSQL, MS SQL server, and NoSQL Datastores (Cassandra, MongoDB)
- Certifications: Google Data Analytics Professional Certificate, AWS Solutions Architect Associate, Data Analysis and Visualization with Power BI, Snowflake SnowPro Core Certification
- Cloud Technologies: Google Cloud, AWS, Microsoft Azure
- Tools & Technologies: Salesforce, Power BI, Tableau, Snowflake, Informatica, MS Excel Advanced
Experience
- Designed and implemented scalable data warehousing solutions and merchant onboarding process, managing over 10TB of financial data for Citi Bank, improving data retrieval speed by 40%.
- Led backlog prioritization and sprint planning with cross-functional teams using Agile methodology and Jira, ensuring timely delivery of reporting automation and audit pipelines.
- Implemented compliance automation initiatives by integrating SQL rule-based validation and real-time monitoring, decreasing manual review cycles by 30% and improving SLA adherence.
- Developed and automated ETL pipelines integrating AWS services and Snowflake, streamlining data pre-processing, validation, and reporting workflows, reducing manual compliance reporting efforts by 35%.
- Performed Exploratory data analysis (EDA) over 1 million+ transactions of financial data using SQL and Python, uncovering compliance risks and enhancing reporting accuracy, minimizing payment-related defects by 18%.
- Served as the liaison between product teams and data engineers to translate business requirements into system-level enhancements focusing on onboarding automation, approval risk analysis, and reporting standardization.
- Built automated Power BI dashboards visualizing operational KPIs, compliance trends, and approval rates for 10+ financial products, enhancing visibility for leadership and accelerating data-driven decisions.
- Generated advanced MS Excel dashboards with automated calculations, and features like PivotTables, Power Query and VBA macros to analyze and visualize financial metrics, improving reporting efficiency by 25%.
- Mentored 10+ junior analysts and engineers in ETL automation, SQL performance tuning, Power BI visualization, and Lean methodologies, enhancing reporting processes and boosting overall team productivity by 36%. Tools: Python, SQL, Automation, POWER BI
- Designed and implemented a real-time data pipeline using AWS Glue and S3 to ingest and process behavioral health data, automating intake workflows and reducing manual data preparation time by 50% supporting longitudinal tracking of academic and enrollment engagement.
- Implemented AWS Lambda Functions to automate real-time data collection from Reddit using API, processing approximately 10,000+ posts per day.
- Built and maintained structured datasets in AWS Redshift for CRM-linked reporting use cases, enabling the Graduate School to generate cohort-level performance summaries and campaign-based engagement tracking.
- Developed and automated ETL workflows to consolidate academic, engagement, and outreach data from multiple sources (including APIs, and surveys), ensuring centralized availability and consistent formatting across CRM modules.
- Created Tableau dashboards to visualize key trends, behavioral health patterns, and communication funnel metrics used by leadership to drive campaign targeting and event planning strategies.
- Tools: Python, AWS, Apache Airflow, Tableau
- Led weekly lab sessions and mentored 70+ graduate students in data analytics courses, providing technical instruction in SQL, Tableau, and CRM-adjacent concepts such as KPI monitoring and data-driven communication workflows.
- Developed automated grading workflows using Alteryx, streamlining SQL query performance assessments and data analytics projects, reducing manual grading time by 40% and ensuring standardized evaluation criteria for students.
- Guided project-based learning that emphasized A/B testing, hypothesis evaluation, and regression analysis using Python, preparing students to analyze enrollment campaigns and communication engagement data.
- Built interactive Tableau dashboards for faculty and students, enabling real-time tracking of coursework progress, research insights, student performance analytics, driving a 35% improvement in data-driven decision-making.
- Used Python for data manipulation, statistical analysis, and visualization tasks.
- Tools: Python, AWS, Statistical Analysis
Projects

Developed a robust research paper search engine integrating NLP and web scraping techniques to streamline information access.

Performed YouTube data analysis with AWS, automating ETL, ensuring scalability, and delivering dynamic insights.
- Tools: Python, AWS, ETL
- This project securely manages, streamlines, and analyzes over 500,000 structured and semi-structured YouTube video records, focusing on video categories and trending metrics.
- Leveraging AWS services, this project performs ETL tasks and enhances decision-making with real-time insights, improving efficiency by 50% and reducing query times by 70%.

Power BI's Netflix Analytics Dashboard: Explore 5,500 titles, ratings, genres, and global insights dynamically.
- Tools: Power BI, Slicers, DAX Functions
- Dive into Netflix's vast content with in-built interactive search for titles, slicers, dynamic selection, revealing average ratings (7.5) and 10 million votes for 5,500 titles.
- Explore rating distributions and genre performances across 10 categories, leveraging dynamic filters and geomapping for geographic insights into 50 countries.
- Employs DAX (Data Analysis Expressions) for sophisticated calculations, improving efficiency and reducing report loading time by 40%.
Real-Time Weather Data Pipeline using AWS and Snowflake for scalable, efficient, secure insights.
- Tools: Python, AWS, Snowflake, Weather API
- Automates data fetching every hour, ensuring timely updates with up-to-date weather information.
- Handles up to 10,000 weather records per hour with AWS Lambda for high performance.
- Manages monthly storage of up to 1TB data using DynamoDB and S3 for scalable storage solutions.
- Integrates AWS services (DynamoDB, Lambda, S3) and Snowflake for end-to-end data flow, enabling smooth data processing and real-time insights.
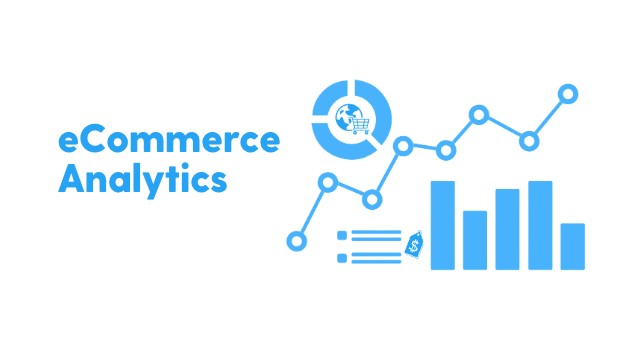
This project simulates an e-commerce environment to analyze purchasing patterns and behaviour utilizing Apriori Algorithm.
- Tools: Python, faker, Scikit-learn, K-means clustering, PCA(Principal Component Analysis)
- Developed a synthetic e-commerce dataset and applied the Apriori algorithm to discover product associations, resulting in a 40% improvement in targeted marketing strategies.
- Segmented customers into distinct clusters using K-means clustering, enhancing personalized marketing efforts by 35%.
- Standardized the data and employed PCA for dimensionality reduction, creating interactive 3D visualizations of customer segments with Plotly.
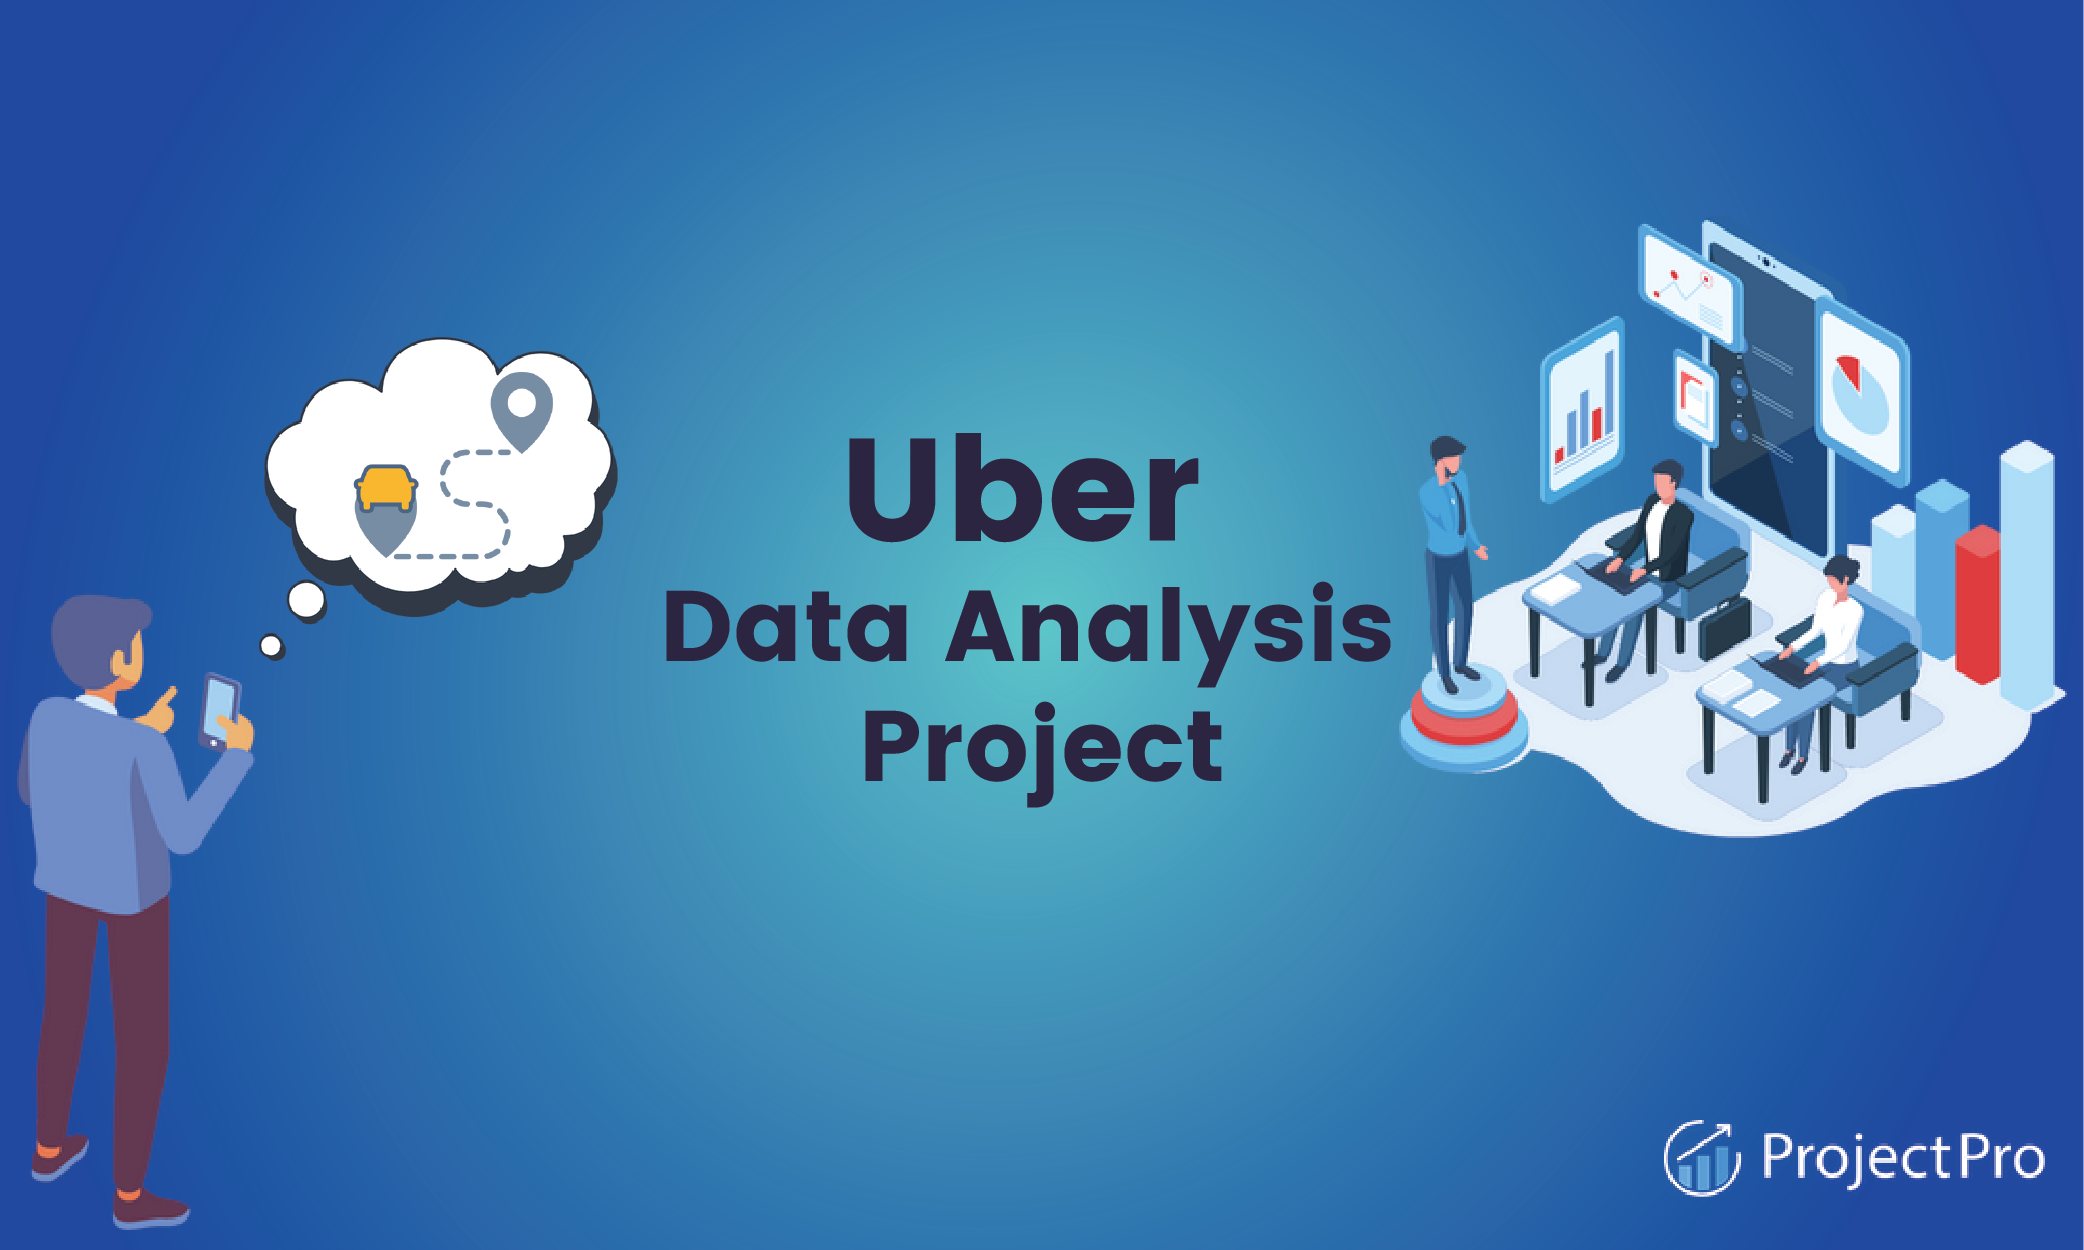
Built an End-to-End data pipeline of Uber data utilizing GCP tools: ETL with Mage, BigQuery analytics, Looker visualizations.
- Tools: Python, Google Cloud platform, Mage, Looker
- Utilizing Mage on Google Compute Engine, this project orchestrates seamless data ingestion, transformation, and loading, handling up to 10,000 records per hour with precision.
- Leveraging BigQuery, it supports rapid query times, reducing processing overhead by 70%, ideal for large-scale Uber trip data analysis.
- Built dynamic dashboards by visualizing trends and patterns, enhancing decision-making with real-time data exploration.

Predict Adidas product sales using machine learning on Kaggle dataset with EDA and regression models.
- Tools: Python, Linear Regression Model, EDA
- Predicting Adidas product sales with accuracy using advanced machine learning models.
- Analyzing a comprehensive dataset of 9652 records from Kaggle, revealing sales trends and patterns.
- Leveraging Exploratory Data Analysis(EDA) visualizations, regression analysis, and R-squared metrics for informed business strategies.

This project offers a dynamic, interactive dashboard for comprehensive income analysis and financial insights.
- Tools: EXCEL, Pivot Tables, KPI
- Detailed view of revenue streams' contributions and performance metrics.
- Harnessed Excel's VLOOKUP and dynamic charting to analyze detailed income streams and financial metrics.
- Utilized PivotTables and conditional formatting for clear insights into revenue sources and geographical income distribution.

Explore Prime Video's extensive library: 9,655 titles, 519 genres, 5,771 directors, and 25 ratings analyzed.
- Tools: Power BI
- Interactive dashboards with slicers and drill-through capabilities, enhancing user engagement significantly and increasing interaction by 30%.
- Understand content distribution by ratings, genres, countries, and release years.
- Interactive filters, tooltips, and color-coded visuals for intuitive exploration.
- Generated comprehensive metrics by analysing 9,655 titles, 25 ratings, 519 genres, and 5,771 directors.
Skills
Languages and Databases
 Python
 HTML5
HTML5
 CSS3
CSS3
 MySQL
MySQL
 PostgreSQL
 Java
Java
Libraries and Frameworks
 NumPy
NumPy
 Pandas
 Scikit-learn
 Matplotlib
 TensorFlow
 Spark-MLib
Cloud Technologies
 AWS
AWS
 Google-Cloud
Tools
 Power-BI
 Tableau
 Snowflake
 Microsoft-Excel
 Informatica
Education
Dekalb, USA
Degree: Master of Science in Computer Science
CGPA: 3.71/4.0
- Algorithms
- Database Management Systems
- Machine Learning
- Operating Systems
- Computer Networks
- Computer Security
Relevant Courseworks:
Sathyabama Institute Of Science and Technology
Chennai, India
Degree: Bachelor of Engineering in Electronics and Communication Engineering
CGPA: 3.6/4.0
- Object oriented Programming
- Big Data Management
- Statistics and Engineering Mathematics
Relevant Courseworks:
